Using a jupyter notebook and Python to summarise World Development Indicators since 1960
In this project I built a jupyter notebook to explore the completeness of the World Bank’s World Development Indictors dataset since 1960. The key libraries used were Pandas and Matplotlib. Pandas did most of the heavy lisfting in terms of processing the data, and matplotlib (with a bit of Seaborn) was used for teh Data Visualisations.
Country Codes presented an interesting challenge for this project, I ended up also using BeautifulSoup to cross reference the country codes with the wikipedia page of ISO country code in order to exclude non-country level statistics from the visualisations (e.g. aggregate statistics for a continent).
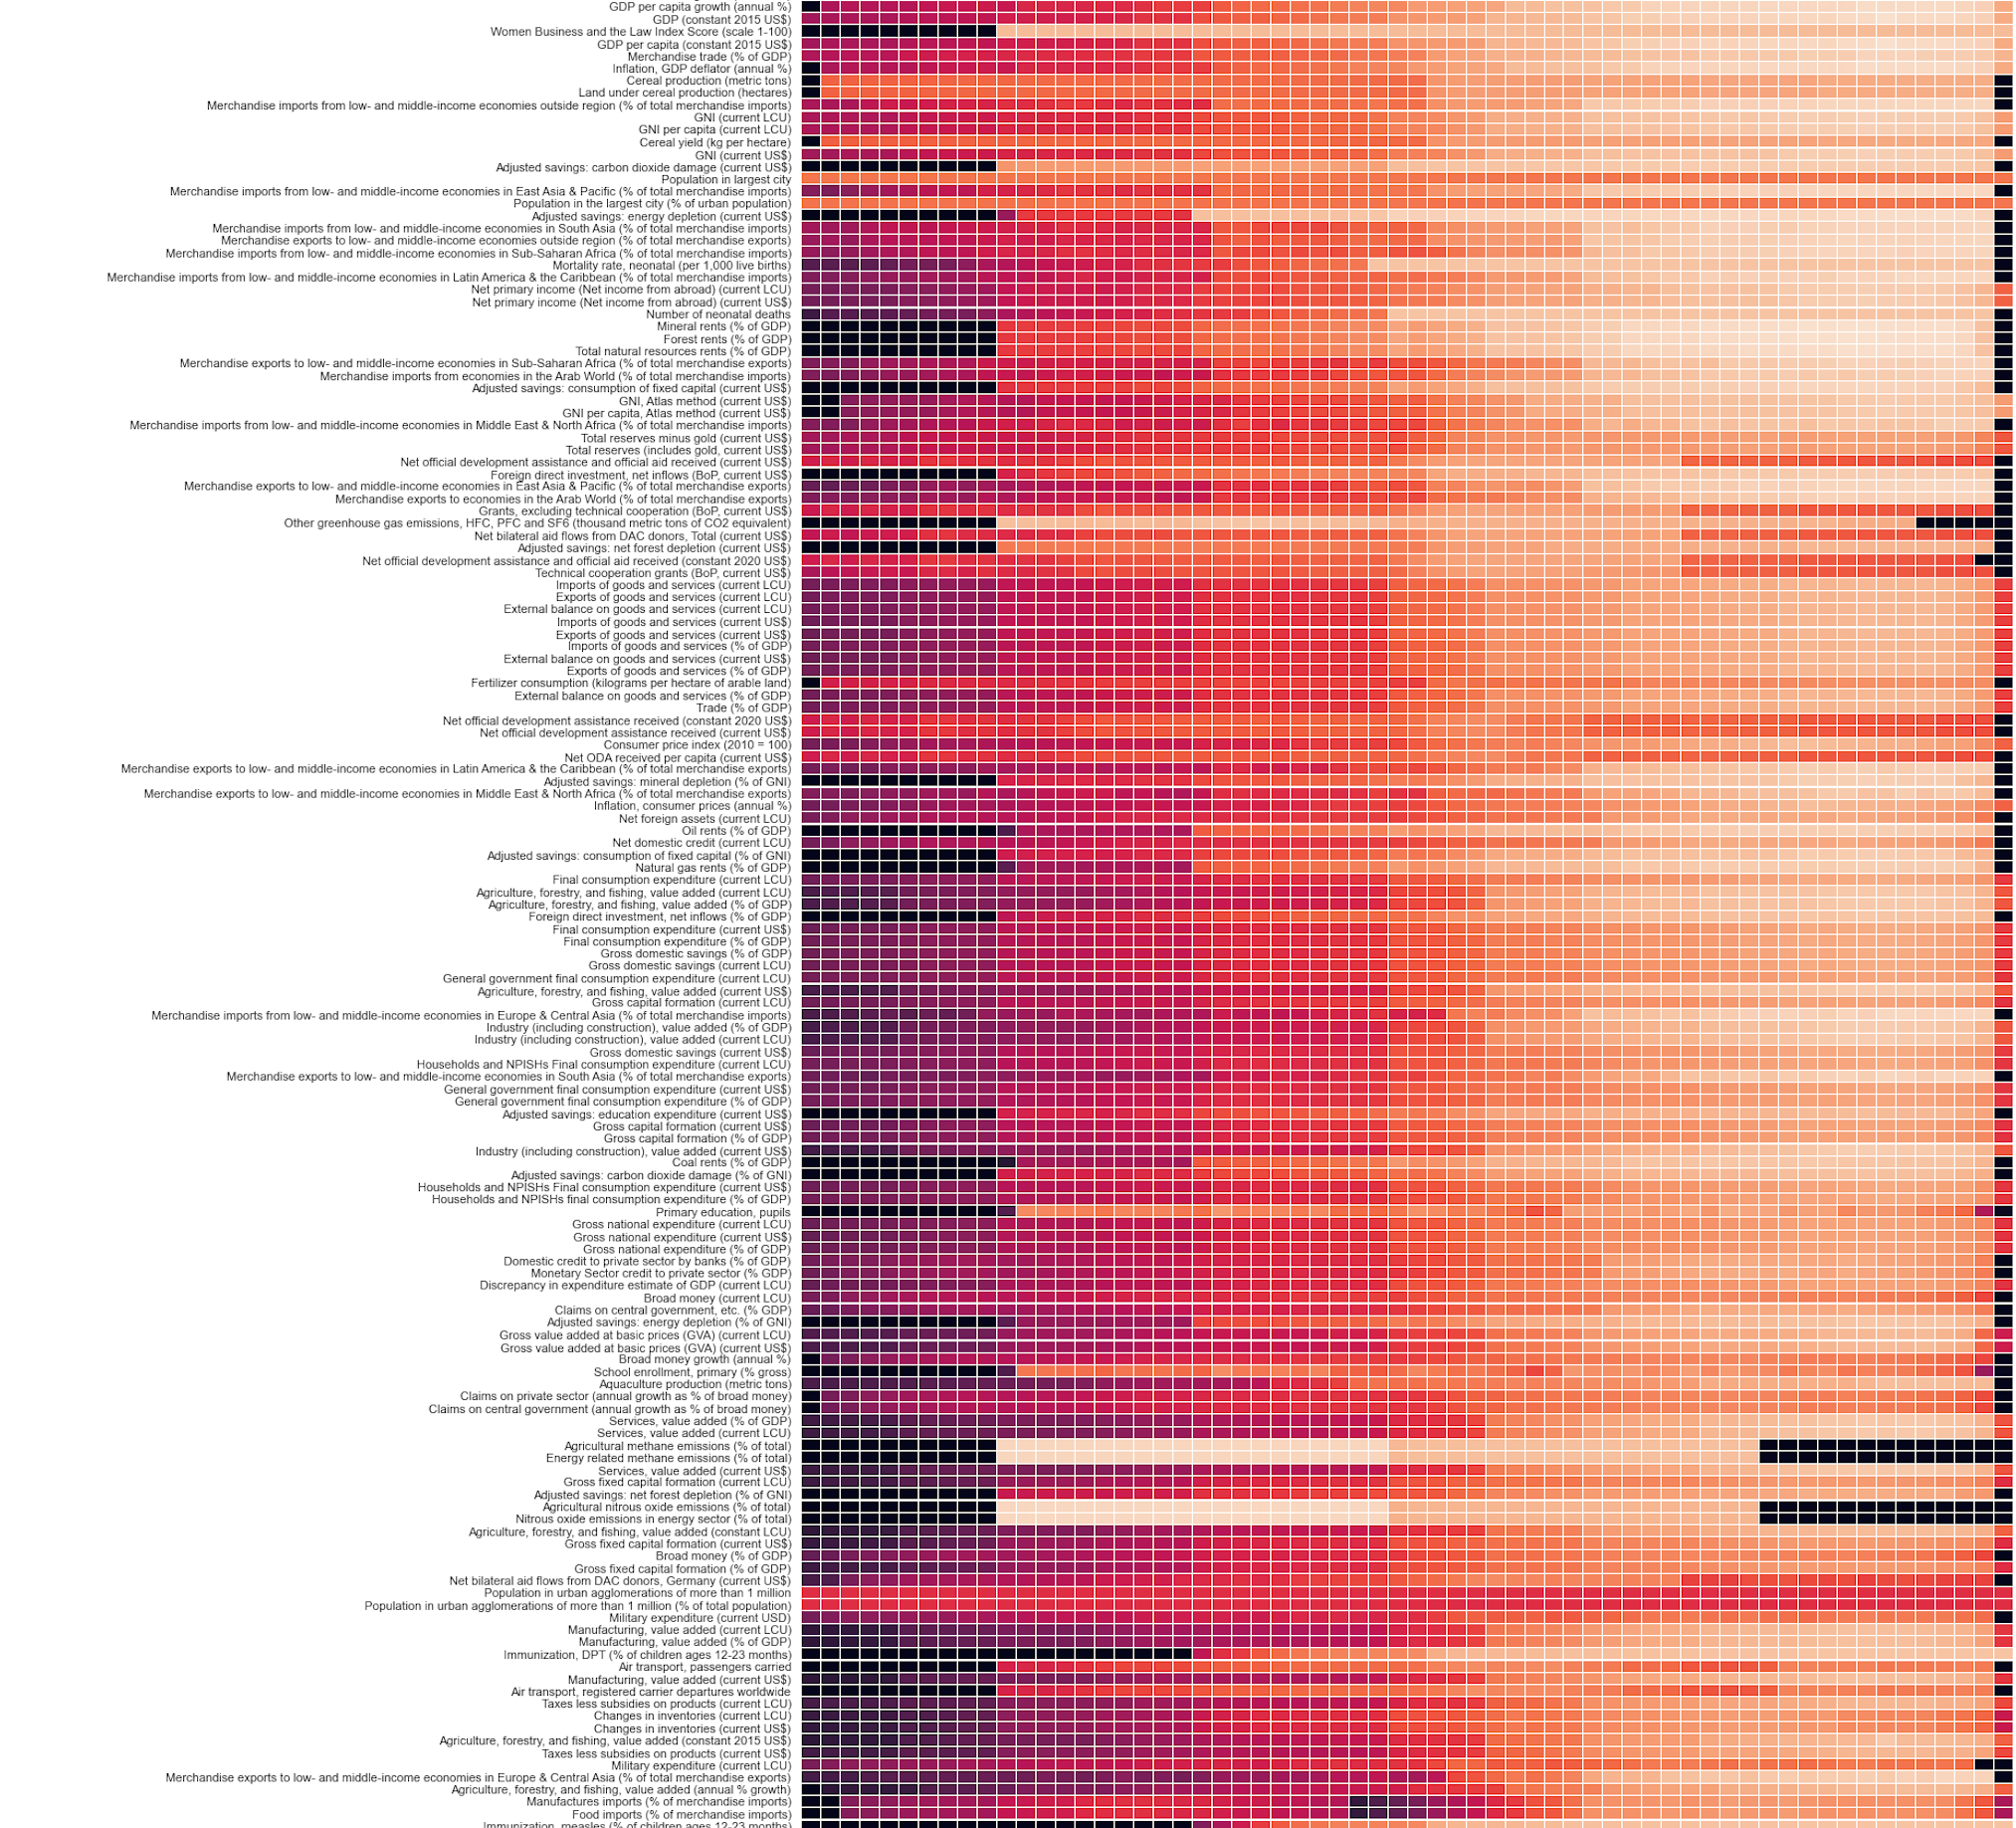
I was particularly pleased with the heatmap visual of indicator completeness over time, you can clearly see the indicators that are recorded once ever 5 years instead of annually on the plot, as well as how some indicators clearly have a significant reporting delay as they disappear in the final years of the dataset. IF I come back to this dataset in the future I might look to create a dashboard using this dataset.
Features
- Reading in data from a PostgreSQL server.
- Descriptive statistics of the dataset.
- Data cleaning to remove empty columns.
- Webscraping to find ISO country codes.
- Reshaping datasets with Pandas.
- Plotting visualisations with Seaborn.
- Summary of key insights.
Snippet of the Heatmap Visual
